
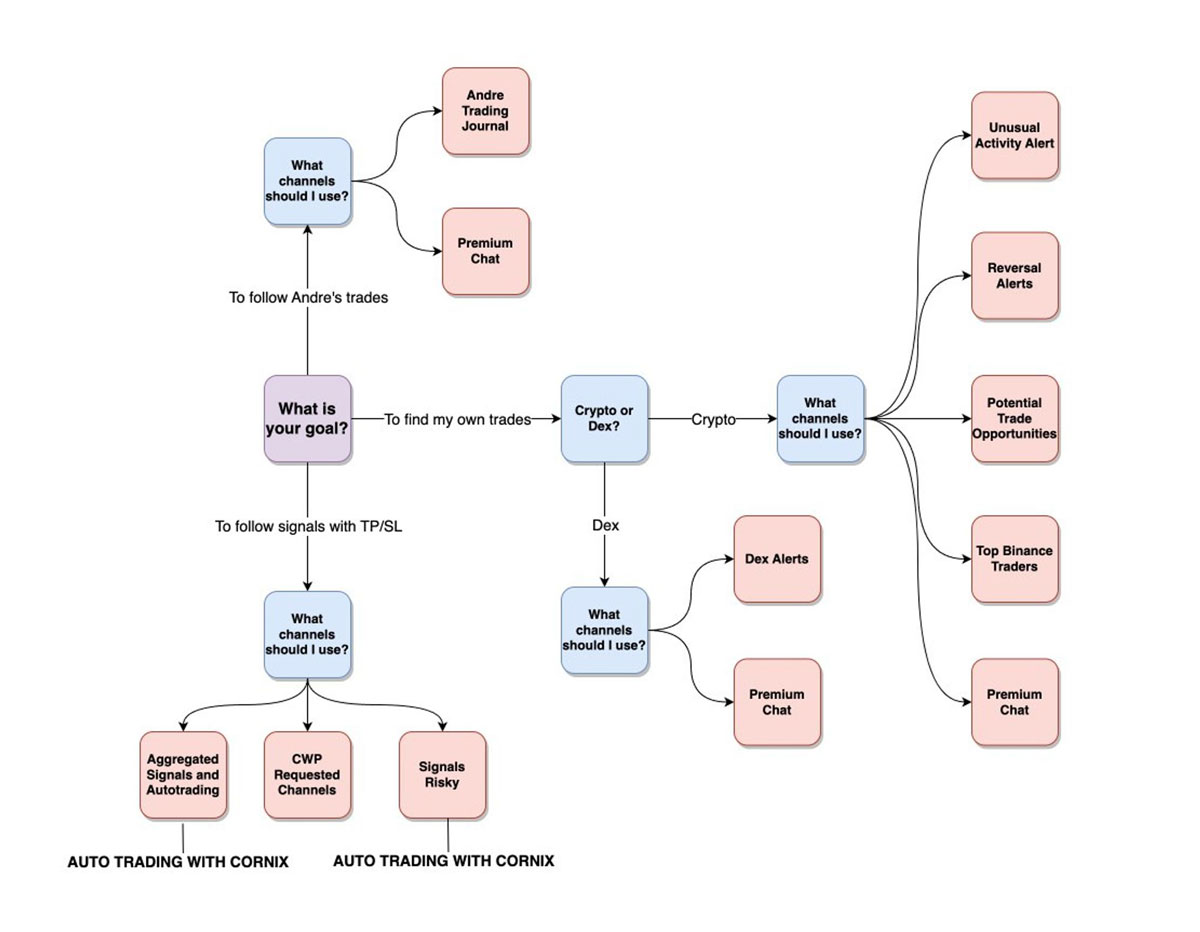
Andre Trading Journal
The Trading Journal provides a unique window into my active trading activity. It’s a live, detailed log of the coins I’m monitoring and the trades I’m making. While I don’t include specific take-profit (TP) or stop-loss (SL) levels, you’ll see exactly when I enter and exit trades.
Why should I follow this?
- Learn from a profitable trader:This is one of the most consistently profitable areas of Crypto Whale Pumps Premium!
- Time commitment: I trade full-time during regular UK market hours (Mon-Fri, 9 AM – 5 PM).
Trading Journal Updates
I’ll provide updates for the following:
- Coins under observation: See what I’m watching and get insight into my analysis.
- Trade Entries: Be alerted to the exact moment I initiate a trade.
- Profit-taking: Know when I’m exiting trades to secure profits.
- Stop-Loss Adjustments: See how I actively manage risk by tweaking stop-loss points.
My Trading Style
I’m a reversal trader focused on quick scalps for optimal profit capture.
Important Note: Since I manage my trades actively, I cannot provide fixed stop-loss levels in the journal in advance.
Mr. B TradinMr. B Trading Journalg Journal
I’m a 32-year-old crypto enthusiast, dedicated to analyzing and trading the markets. Over the past 2-3 years, I’ve immersed myself in the world of Technical Analysis (TA).
My Trading Style:
- Core Tools: Price action and indicators like RSI and MACD are my primary weapons.
- Advanced Techniques: I also incorporate elements of Ichimoku and wave counting for deeper insights.
- Essential Fibonacci: Fibonacci tools are critical for pinpointing key price levels, targets, and potential reversals.
Why I’m Here: I’m excited to share my knowledge, analysis, and trade setups with you! Let’s learn and grow together in this dynamic market.
Premium Signals
DETAILS COMING SOON
Premium Chat
Our Premium Chat is a vibrant 24/7 community where experienced traders connect, collaborate, and learn together. Here’s what you’ll find:
- Valuable Insights: Get actionable tips, trade ideas, and market analysis from seasoned traders.
- Real-Time Support: Have a question? Get prompt and reliable answers from our knowledgeable and helpful member base.
- A Collaborative Environment: Share your own trades, ask for feedback, and build relationships with like-minded individuals.
Crypto Whale Pumps - Crypto Alerts
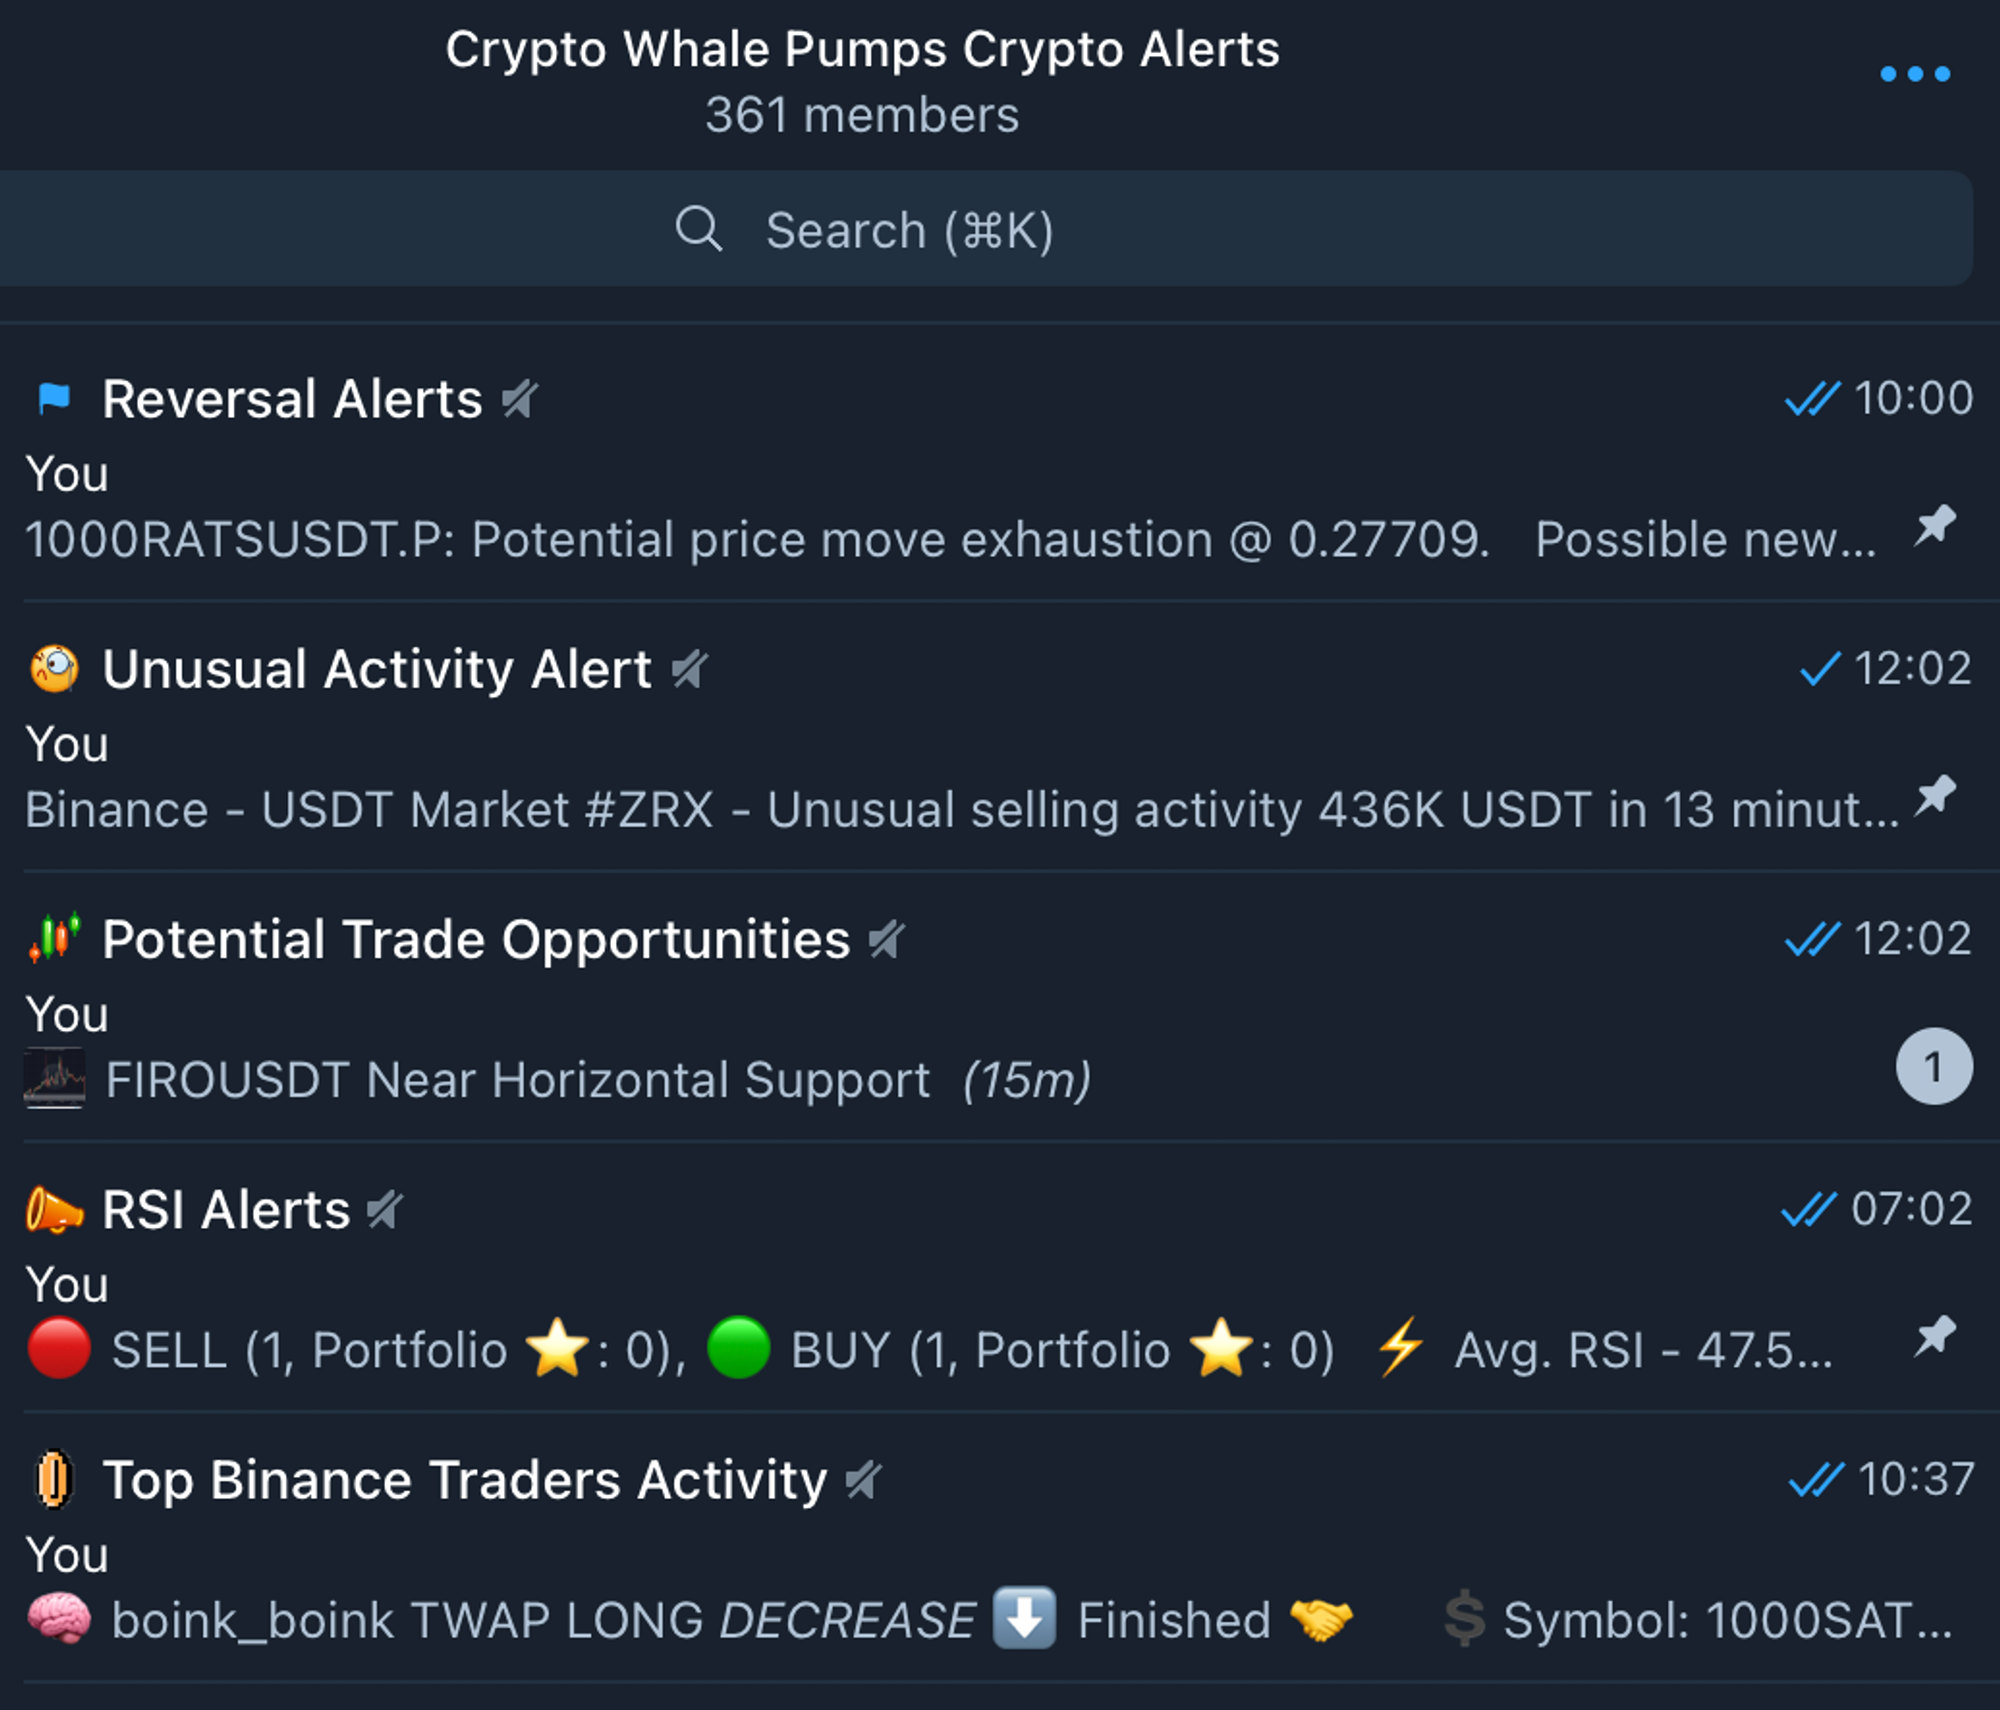
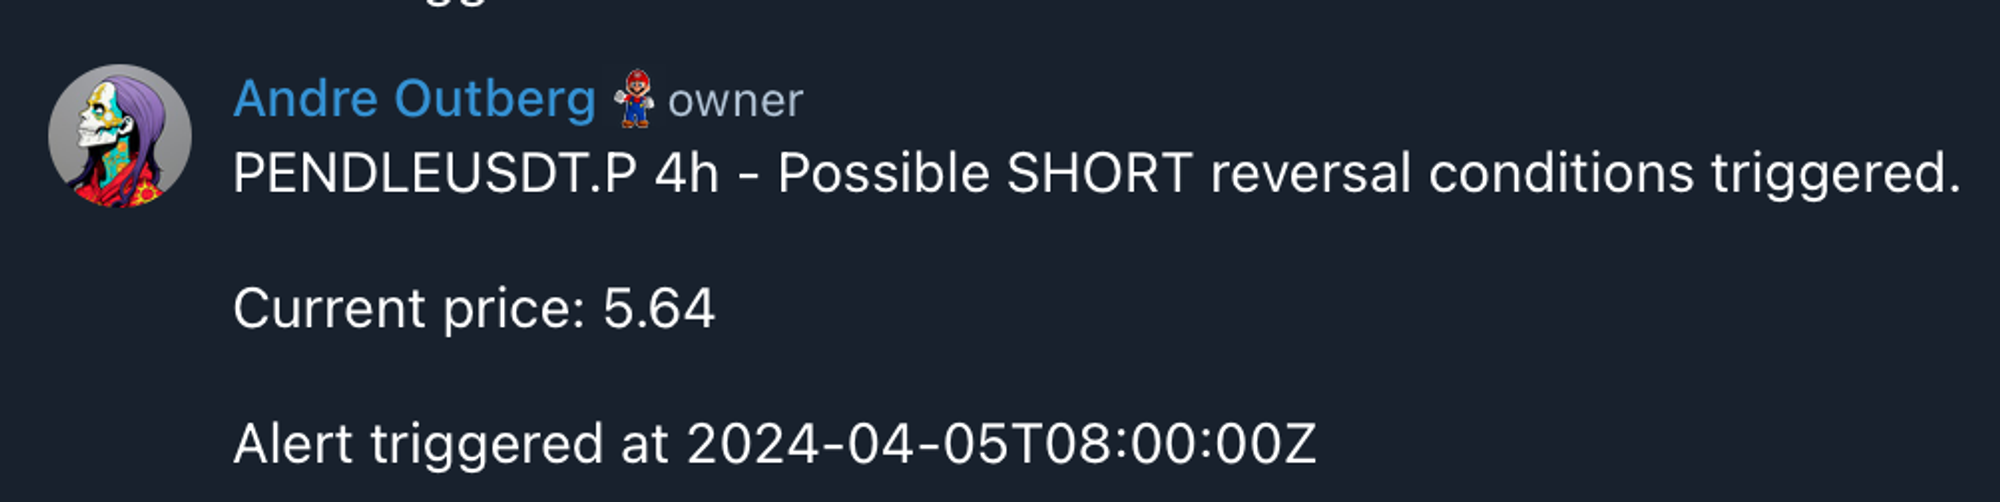
Reversal Alerts
Our custom-designed Reversal Alerts give you a powerful tool to pinpoint potential trend changes in the market. Here’s what you need to know:
Two Key Alert Types:
- Type 1:Signals an early indication of a potential price reversal.
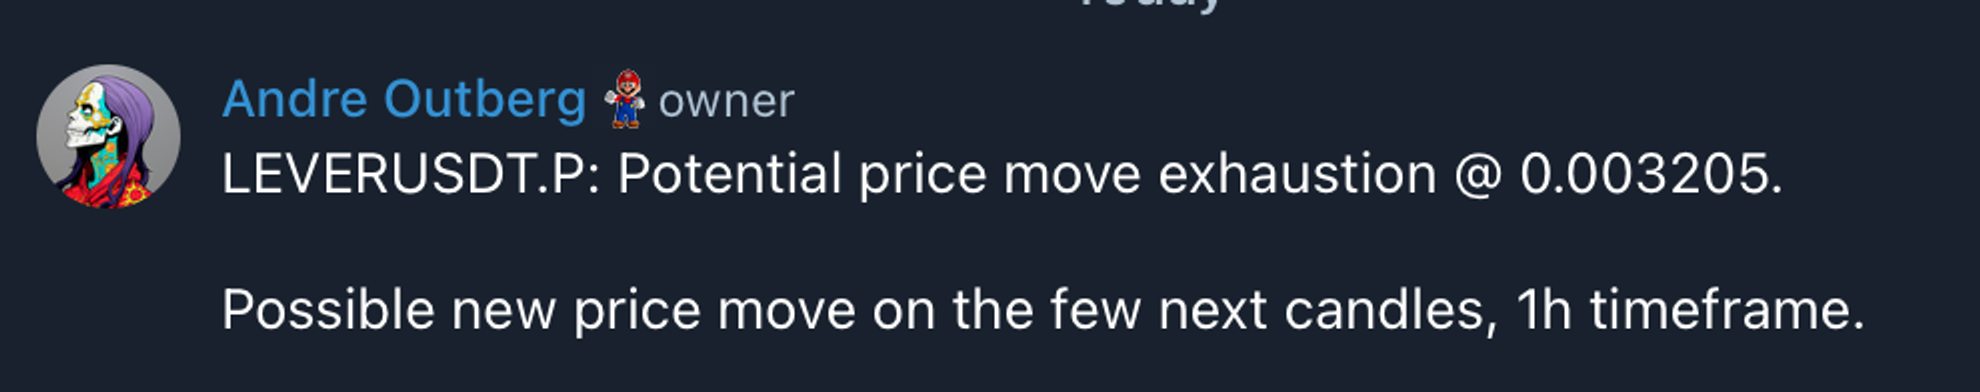
- Type 2: Provides stronger confirmation that a potential short opportunity is emerging, especially when the price is in a resistance zone and the trend is shifting.
How to Use These Alerts:
- Strategic Enhancement: Reversal Alerts are designed to complement your existing analysis and strategies, not replace them.
- Confirmation is Key:Use these alerts to validate your trading decisions and identify high-probability entry points.
Unusual Activity Alerts
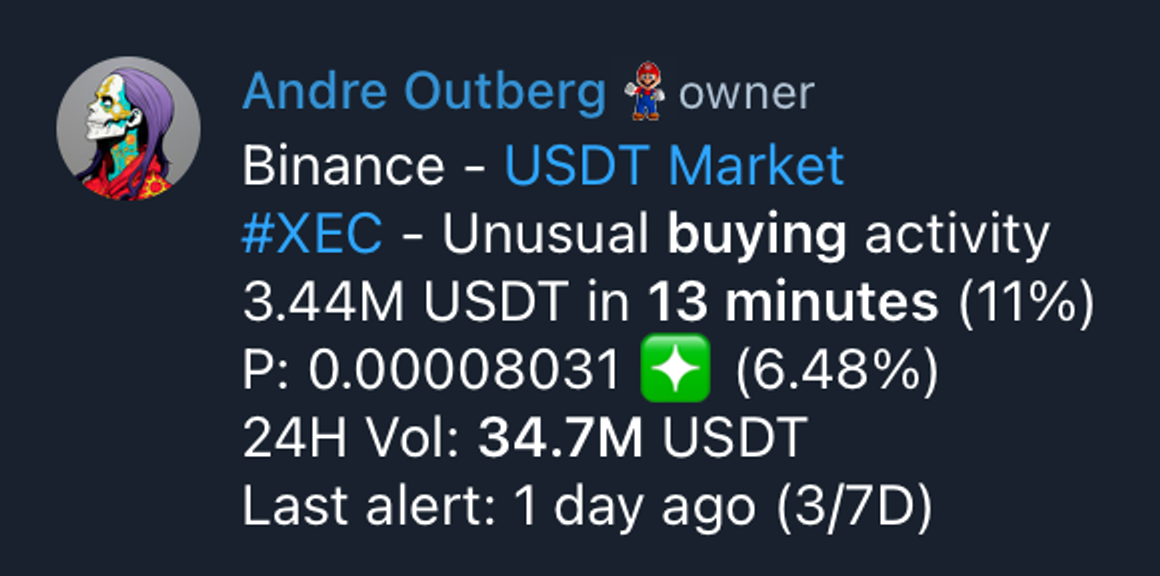
I use these alerts to identify potential reversal opportunities. Here’s how to read them:
- Binance – USDT Market: This indicates the exchange where the unusual activity was spotted.
- #XEC – Unusual buying activity: The type of activity (buying or selling) and the coin involved. In this case, a ‘buying’ alert suggests looking for a potential short position.
- 3.44M USDT in 13 minutes (11%):A large amount of USDT has been used to buy XEC in a short timeframe. This signals high volatility. The lower the timeframe the better.
- P: 0.00008031 ❇️ (6.48%): This is crucial! The price of XEC has increased by 6.48%. A significant price jump like this often precedes a reversal.
- 24H Vol: 34.7M USDT: 24-hour trading volume of XEC (less crucial for this strategy).
- Last alert: 1 day ago (3/7D): Relatively few alerts for XEC in the past week indicate a potentially stronger opportunity.
Key Takeaway:
This alert shows unusual buying activity for XEC, with a large price increase in a short time. This could signal an upcoming trend reversal, making it a good time to consider a short position. Remember to always confirm with your own analysis!
Potential Trade Opportunities
Think of these alerts as a friend pointing out potentially profitable trades. They’re not direct signals, but rather strong hints to investigate further. Here’s a breakdown of the key alert types:
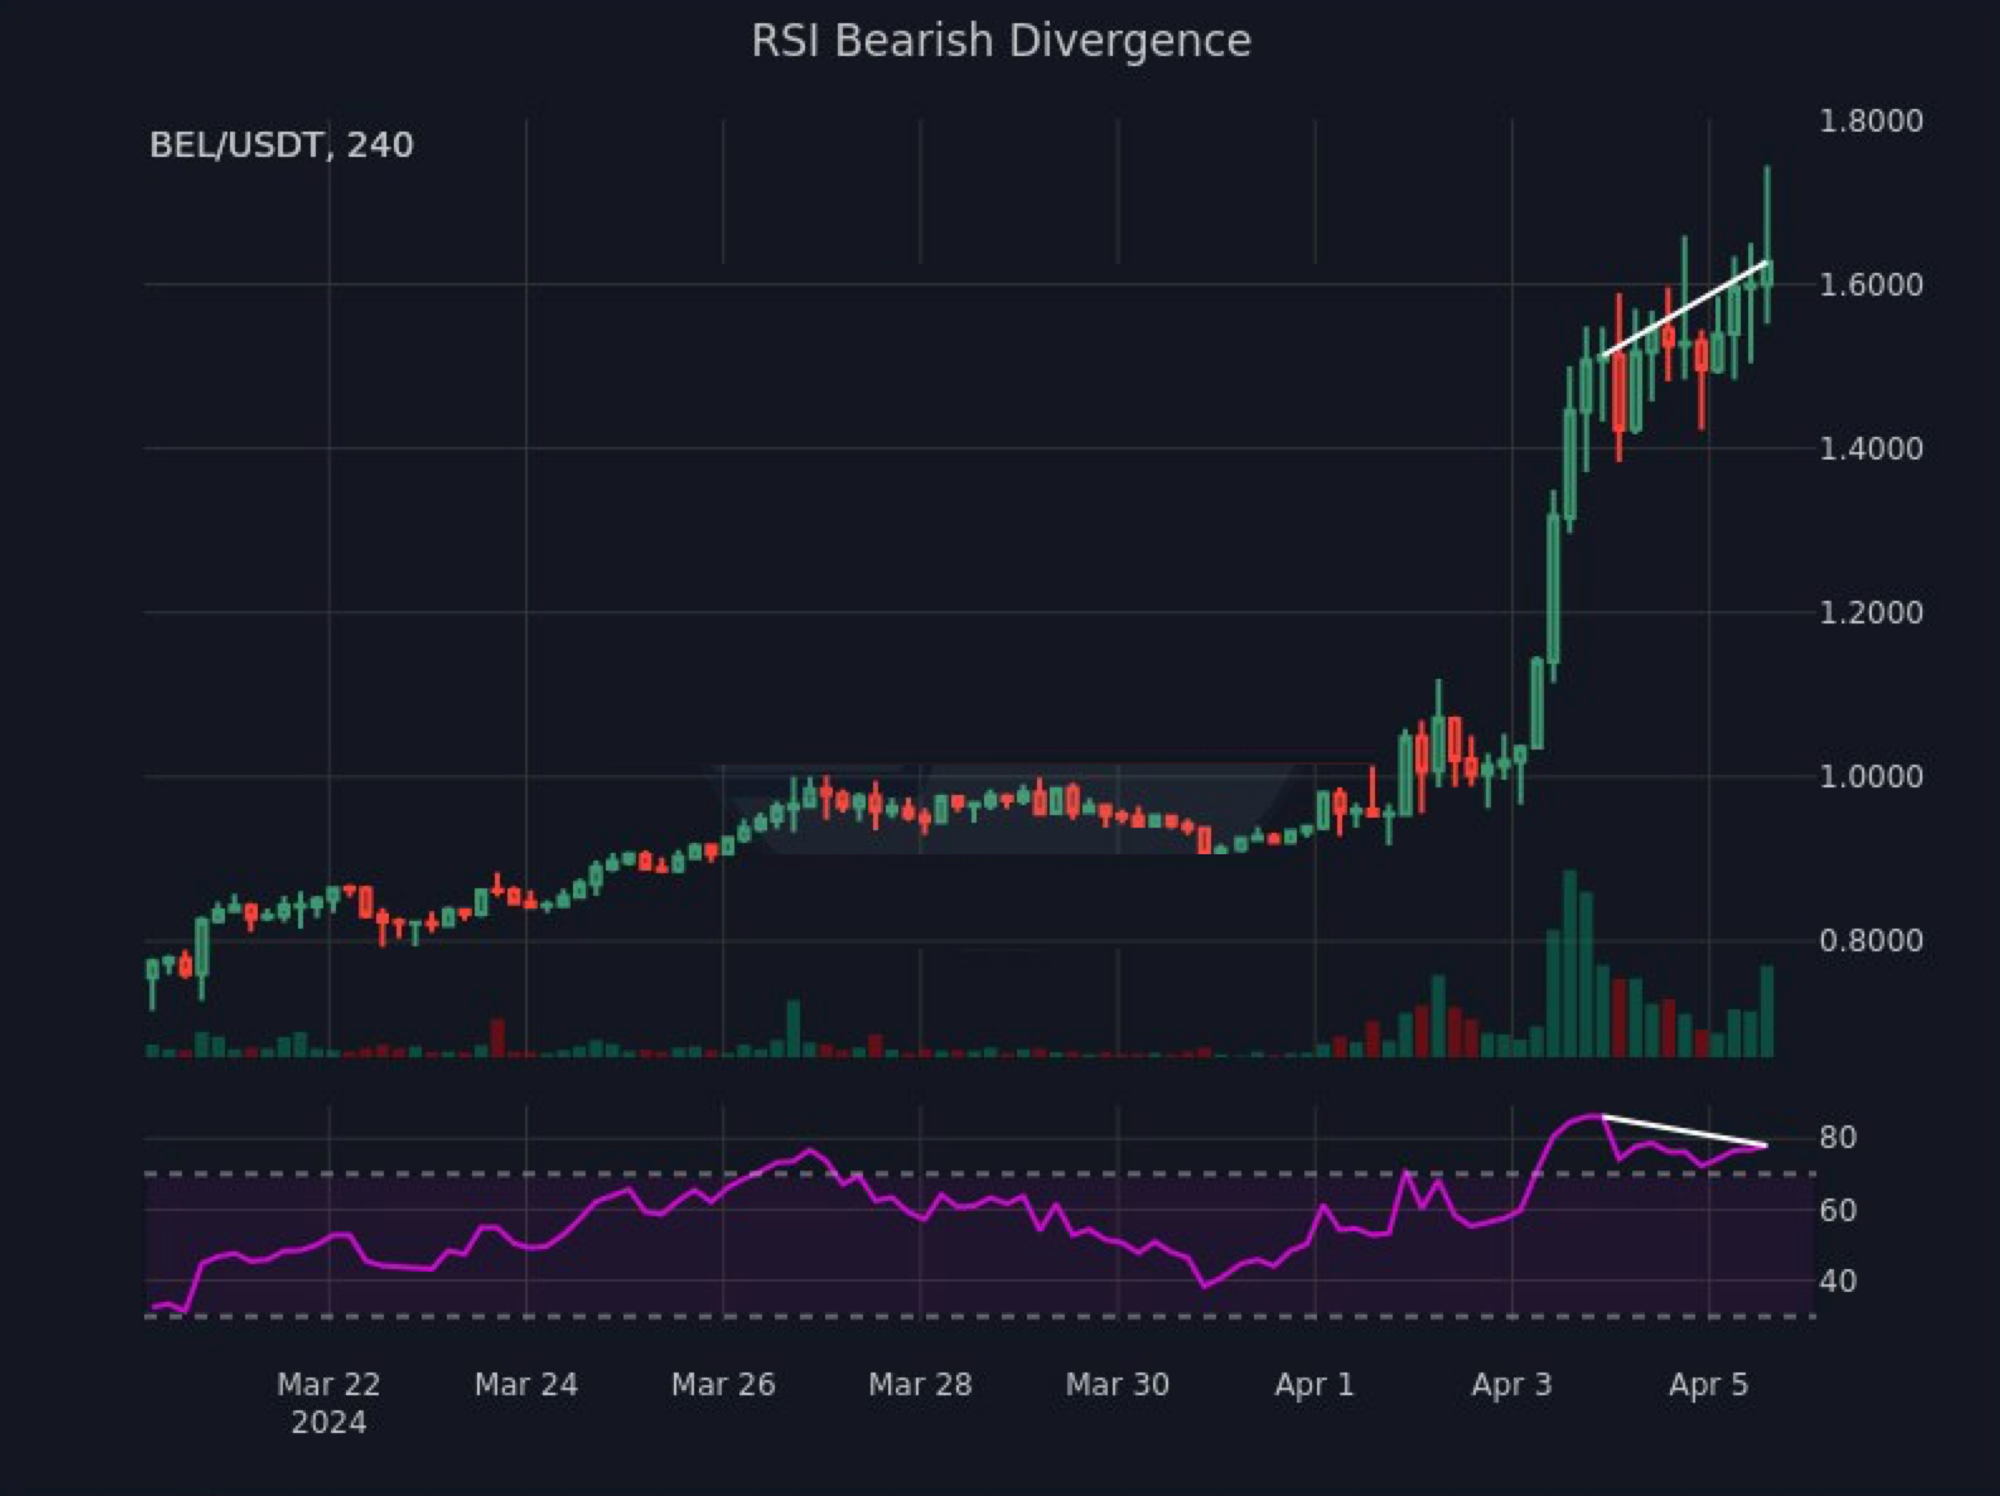
RSI Bearish Divergence
- What it means:Prices hit new highs, but momentum (measured by RSI) is weakening.
- Potential outcome: Price drop might be incoming.
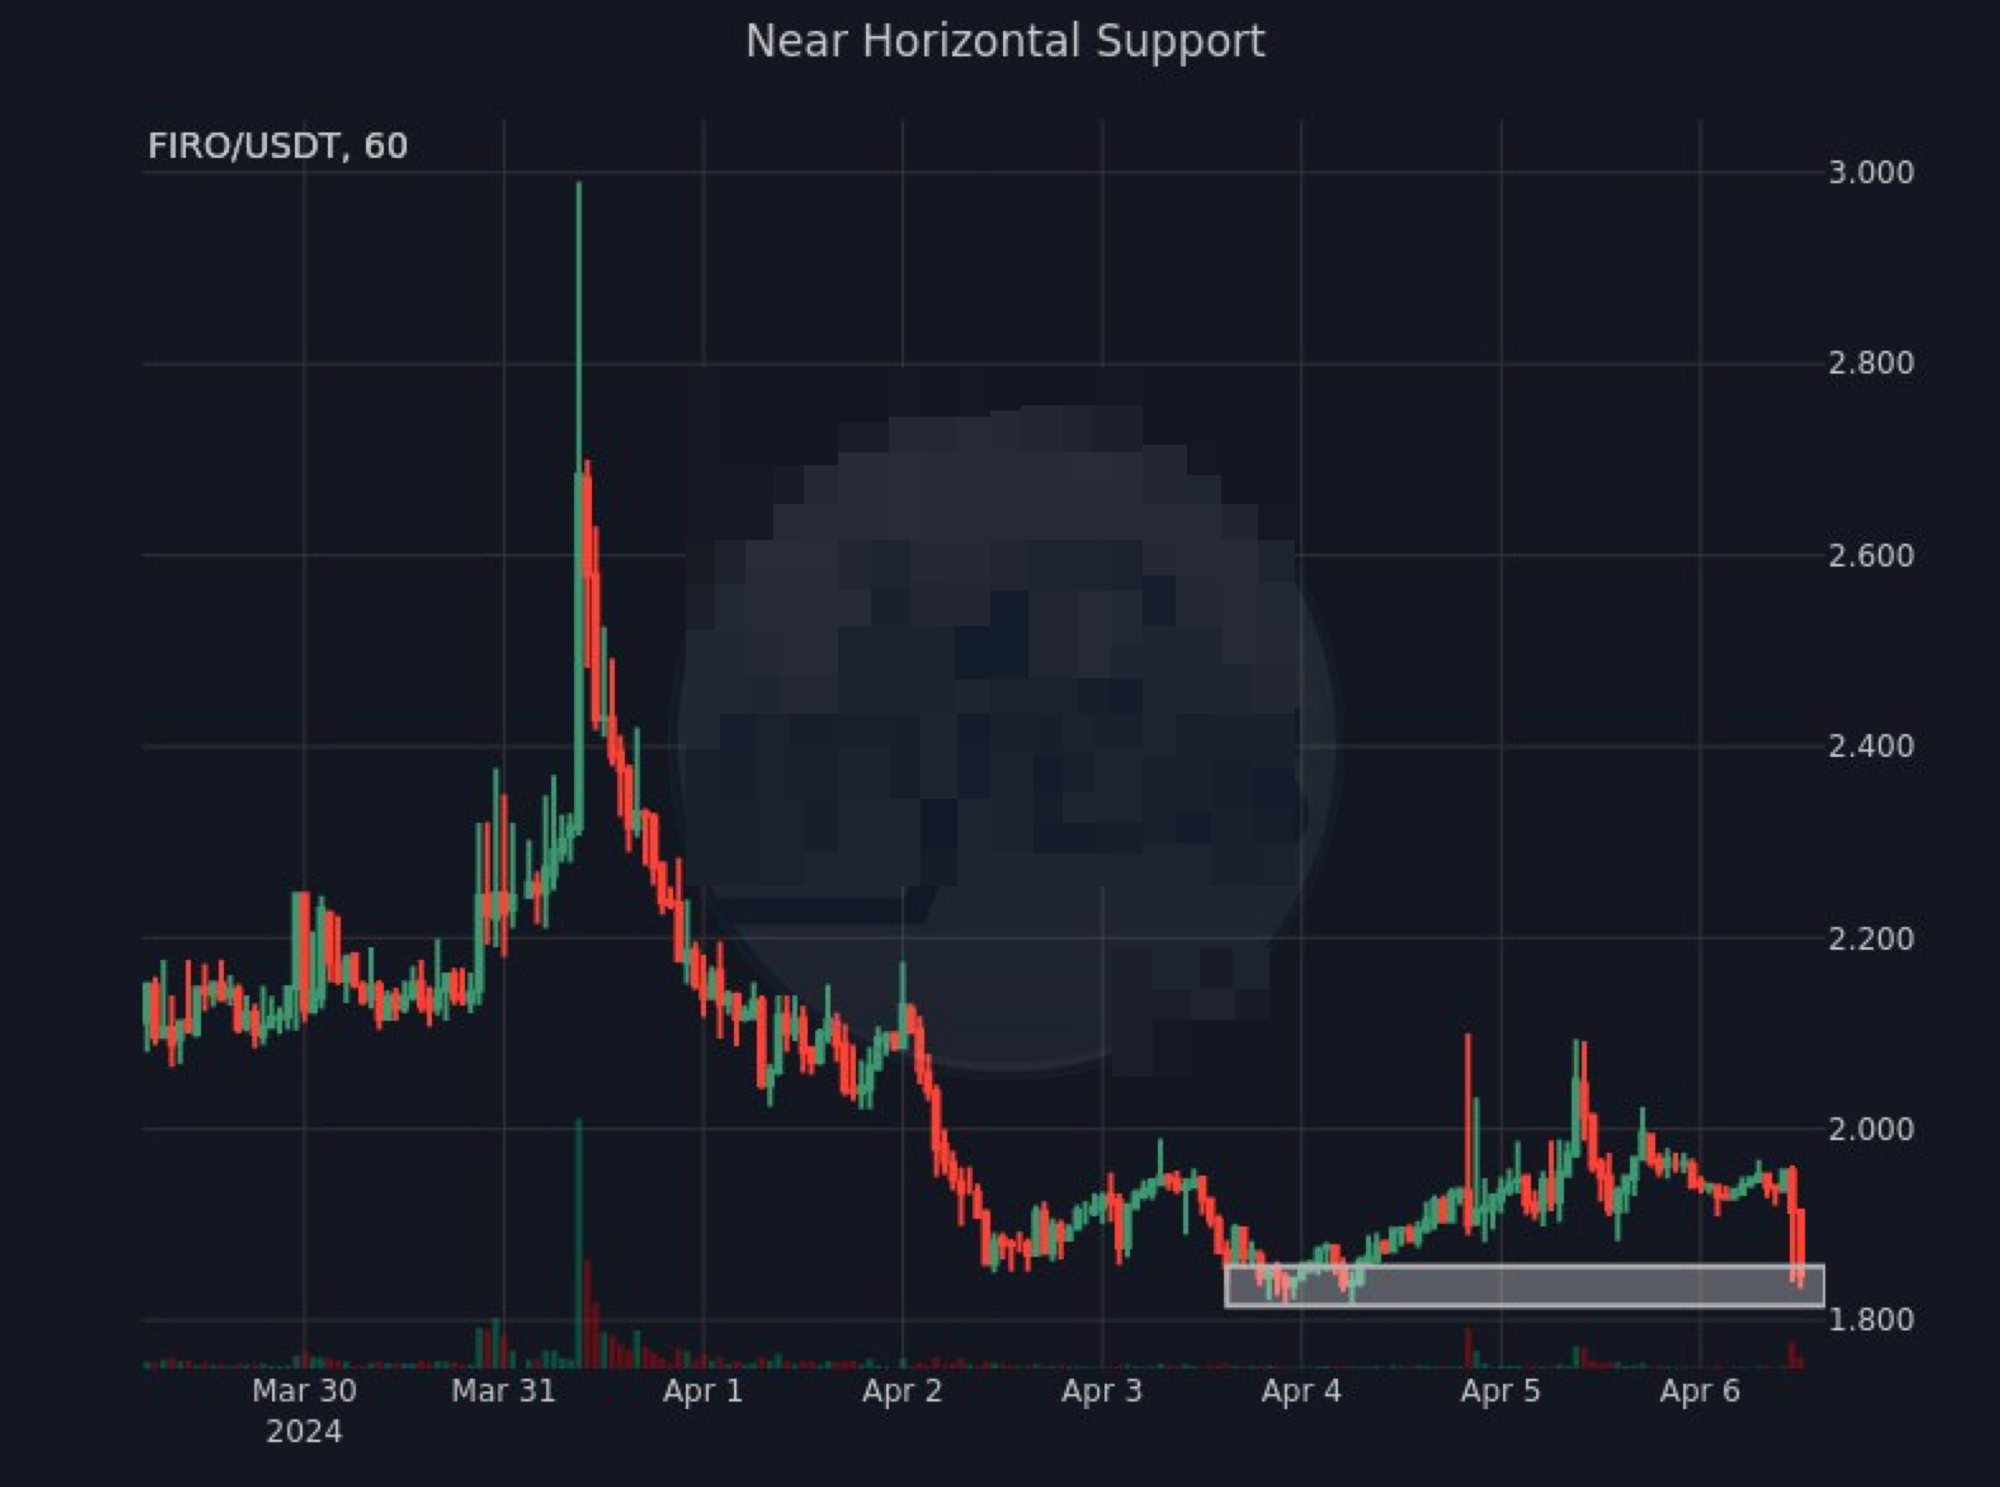
Horizontal Support
- What it is: A price level that has historically acted as a “floor,” preventing further drops.
- How to use it:– Look for potential bounces (upward reversals) when the price hits support.
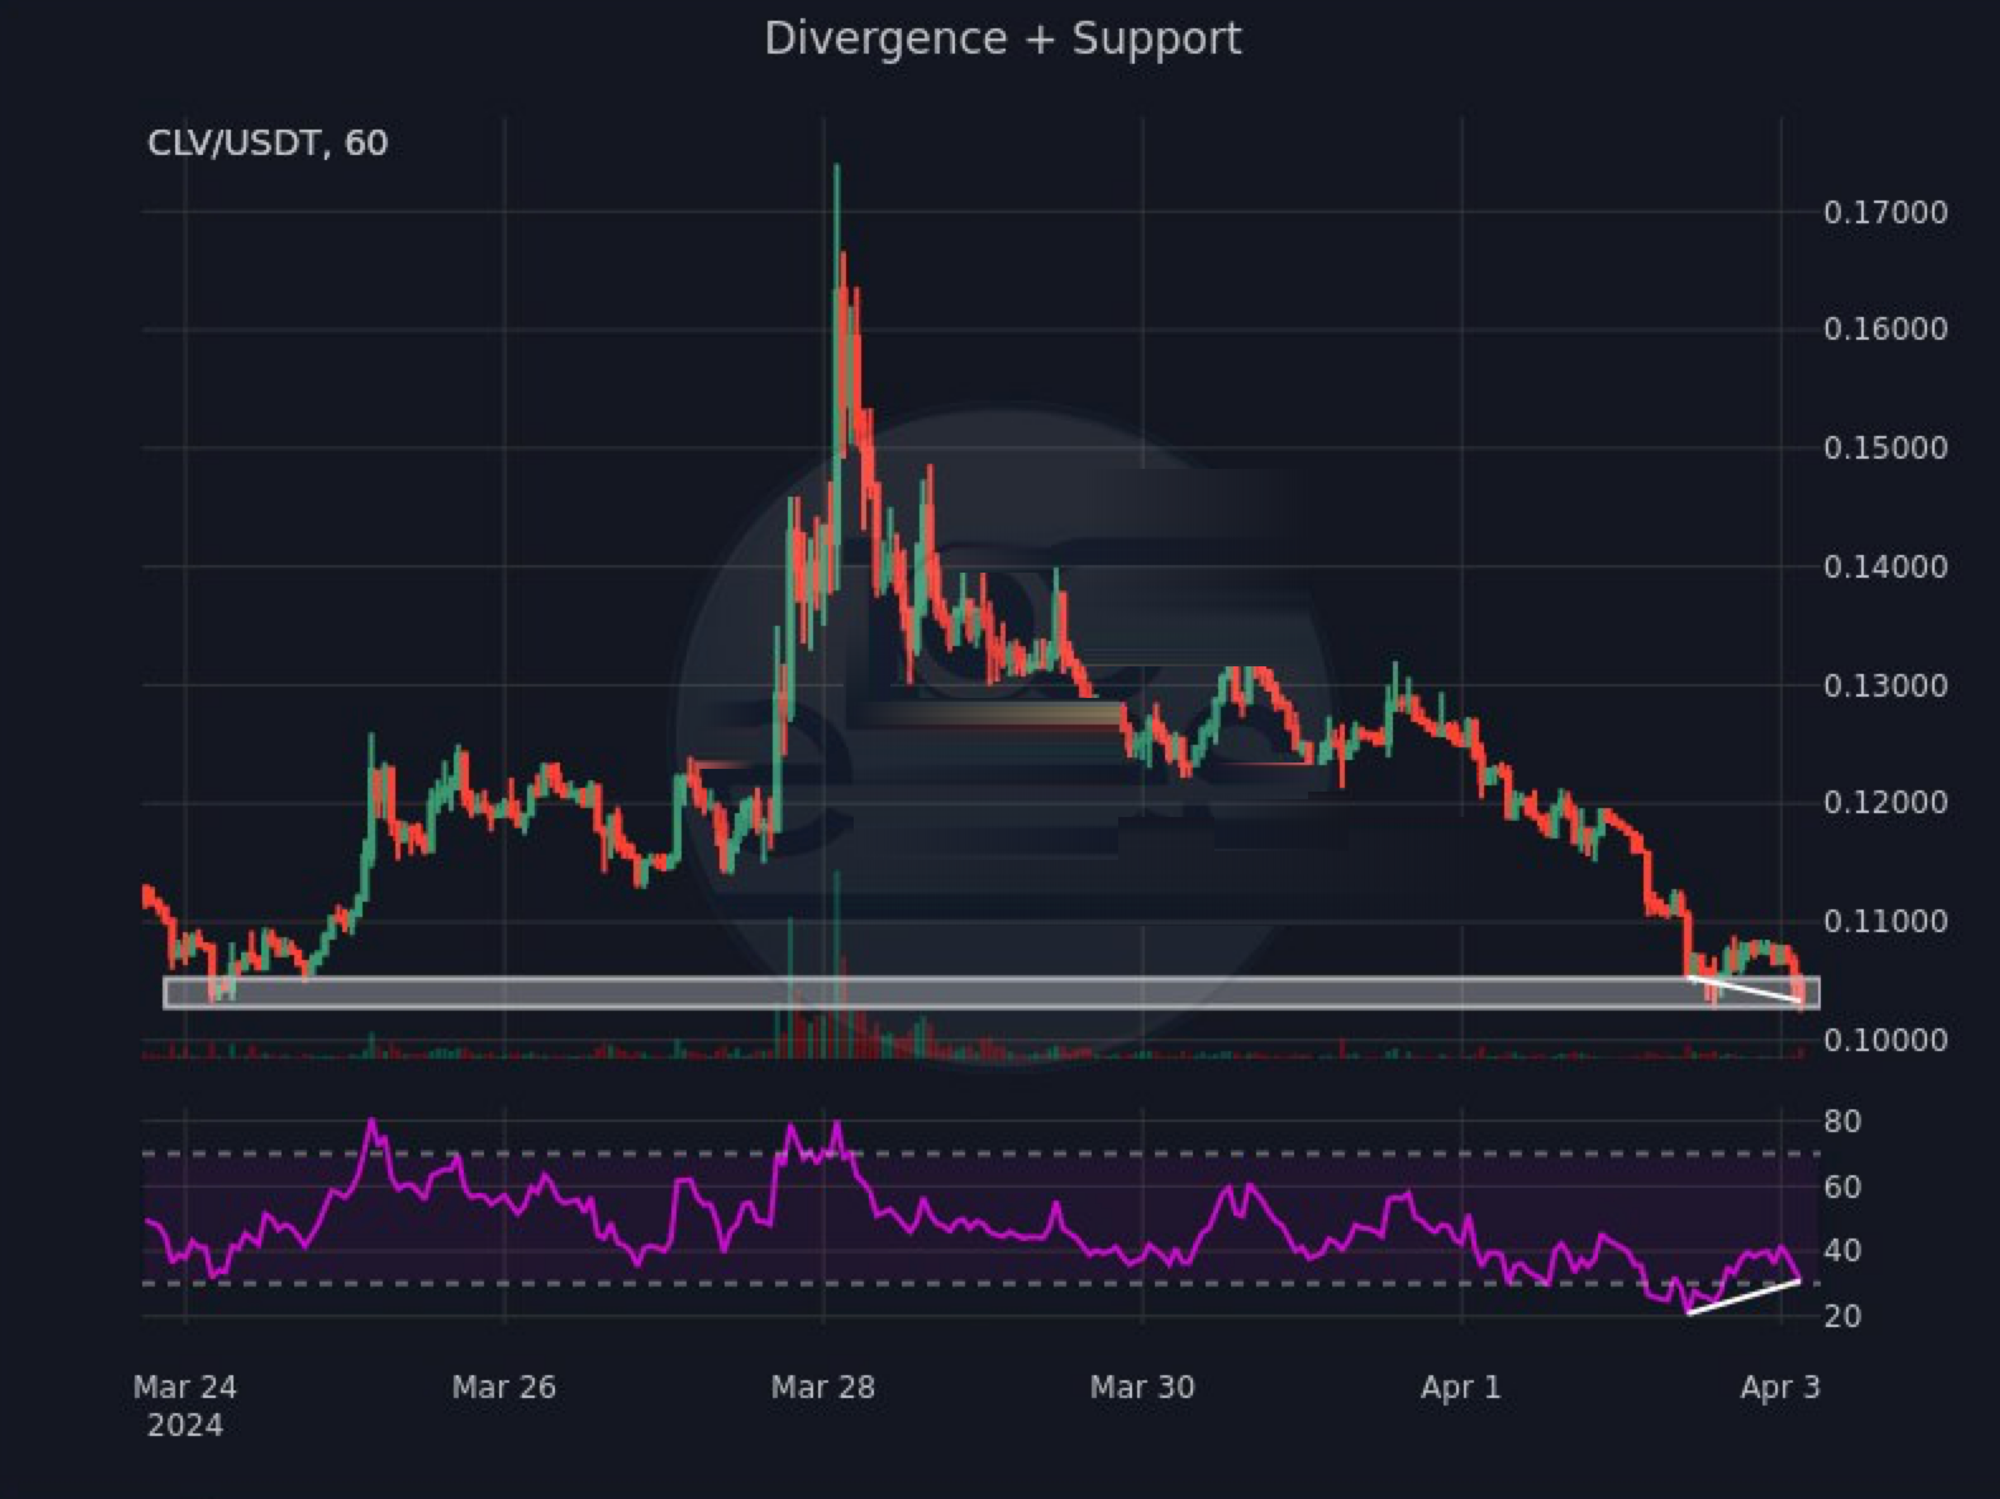
Bullish Divergence + Resistance
- What it means: Prices are falling, but momentum is starting to rise (RSI), and this happens near a resistance level that’s now acting as support.
- Potential outcome:– Upward price movement possible.
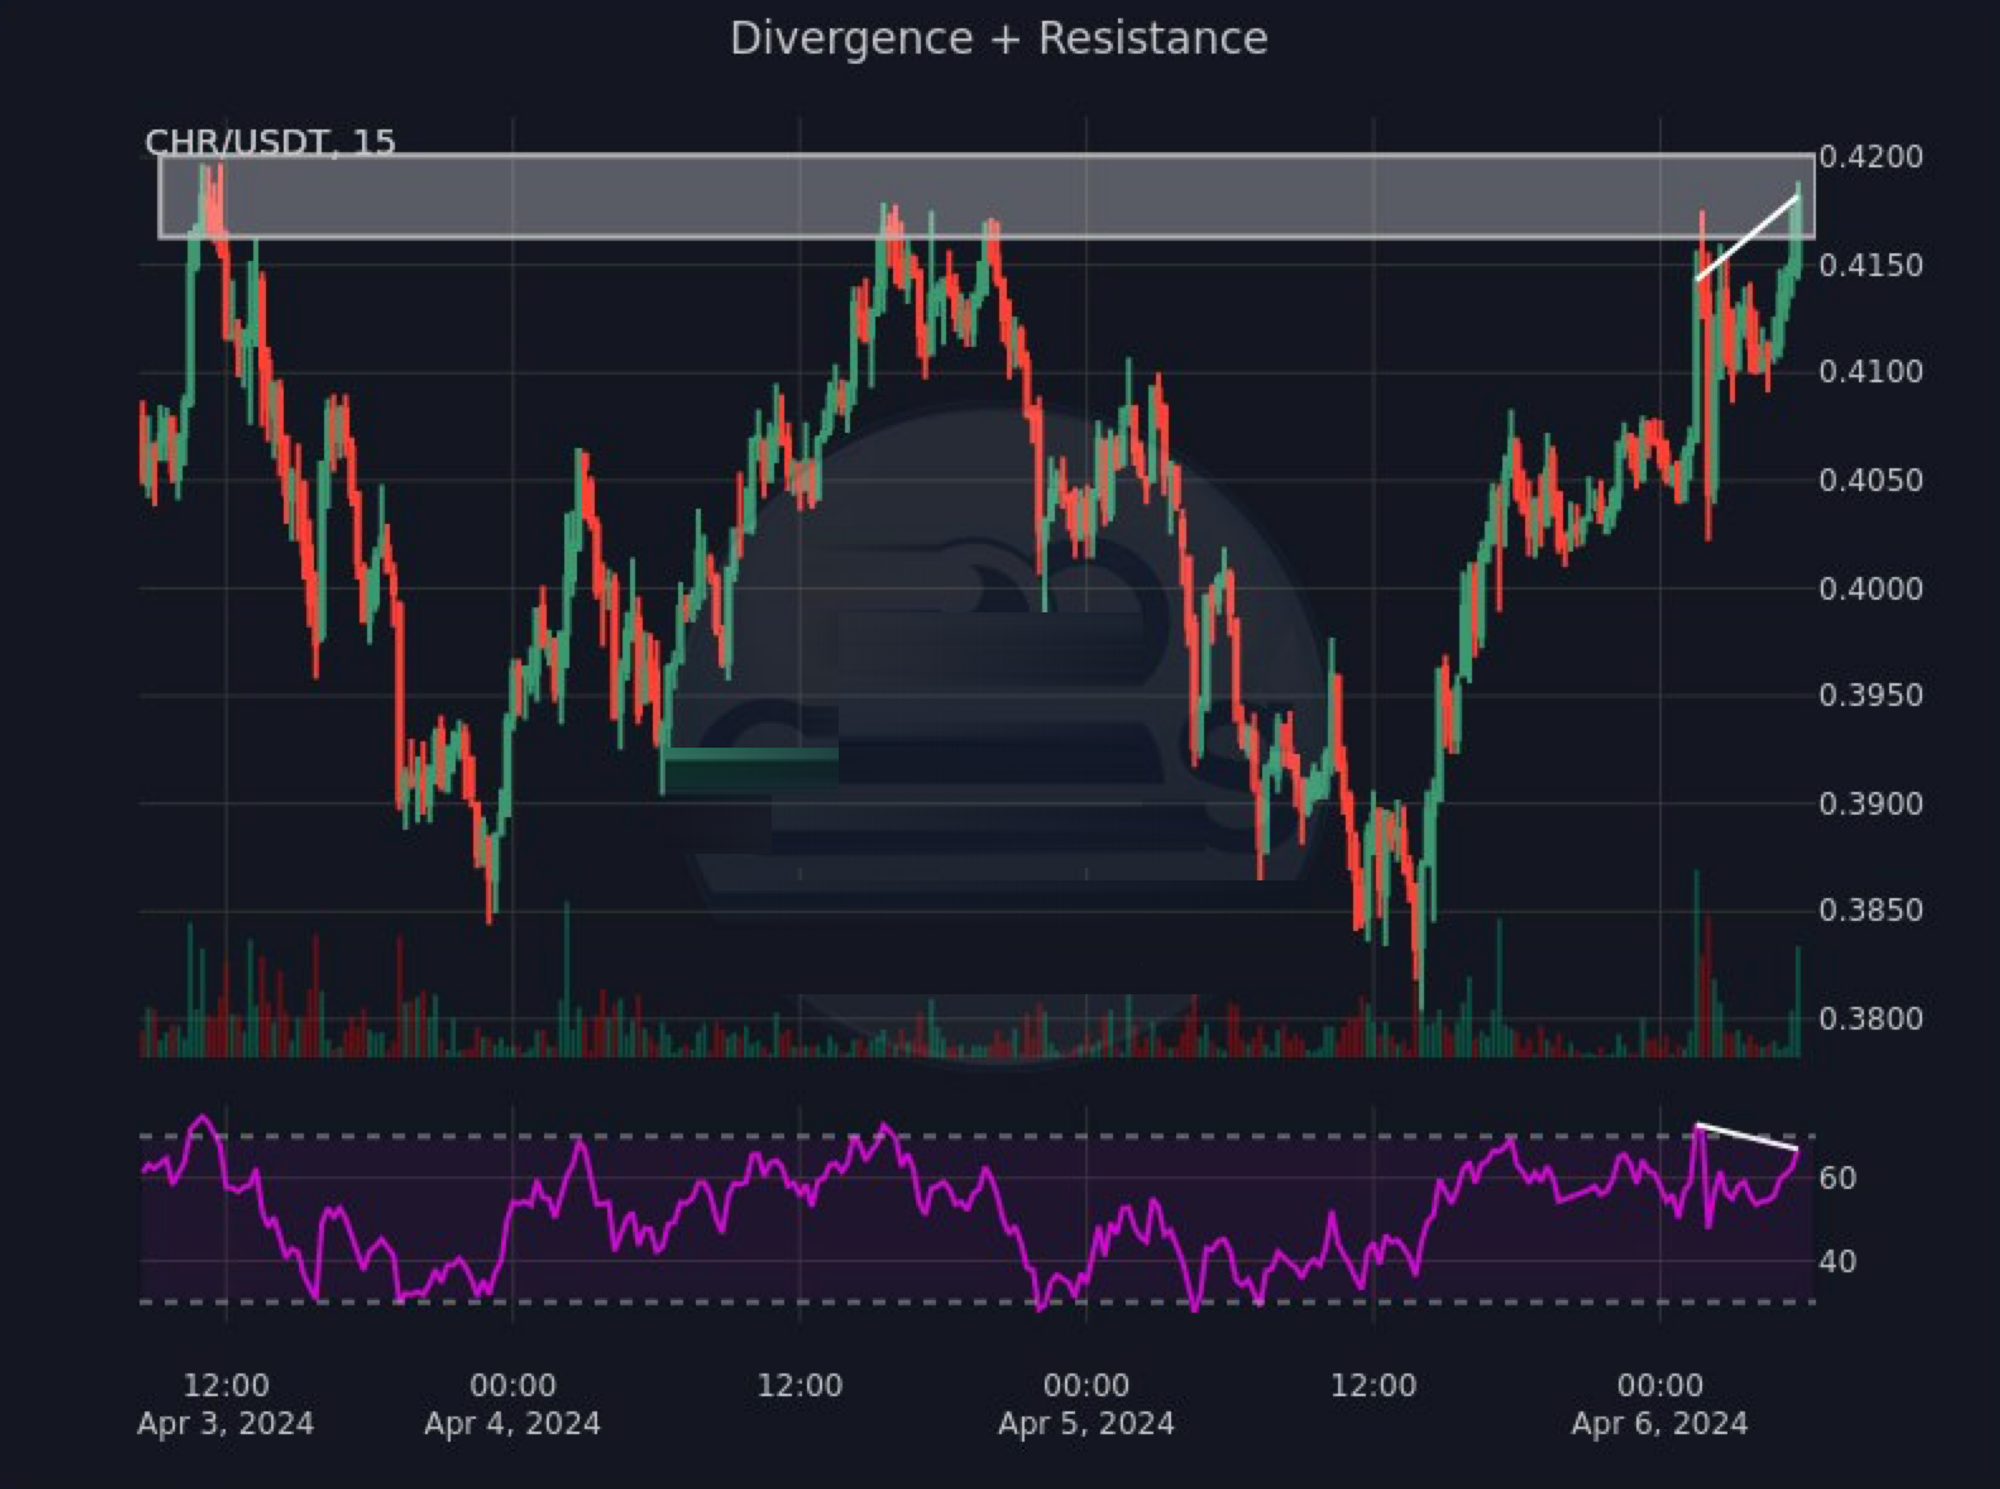
Bearish Divergence + Resistance
- What it means: Prices are rising, but momentum is weakening (RSI), and this happens near a resistance level.
- Potential outcome: Downward price movement possible.
RSI Extremely Overbought
- What it means: RSI is very high (above 70), suggesting the asset may be overvalued.
- Potential outcome: Price pullback or reversal.
RSI Extremely Oversold
- What it means: RSI is very low (below 30), suggesting the asset may be undervalued.
- Potential outcome: Price rebound or reversal.
Important Reminder: Always combine these alerts with your own analysis before making any trading decisions!
RSI Alerts
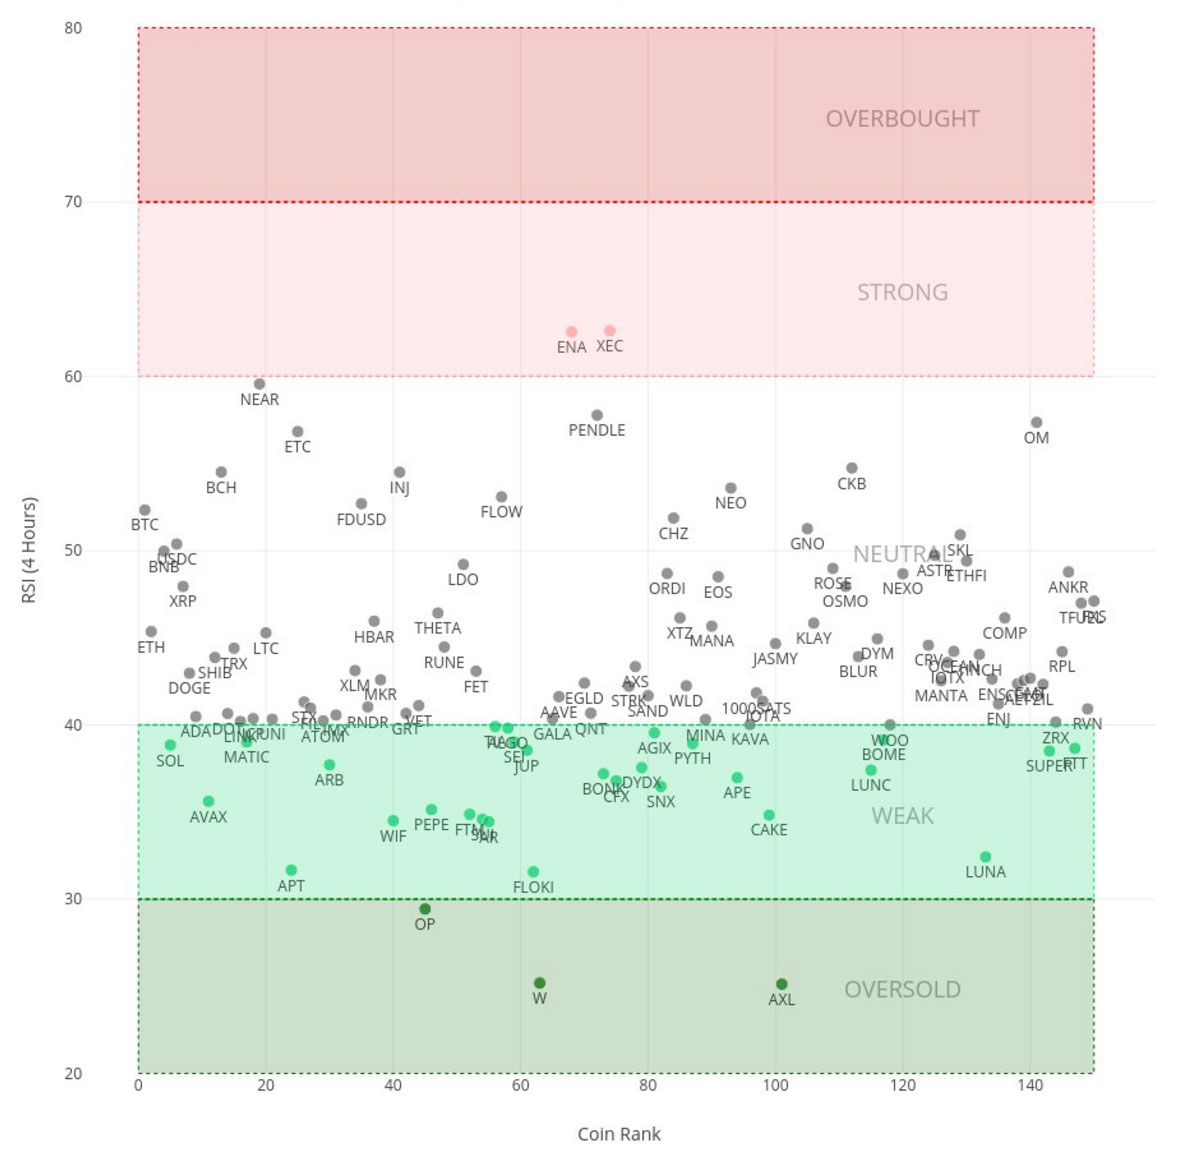
The Relative Strength Index (RSI) is a popular tool that helps traders measure the strength and speed of price movements. Here’s a quick breakdown:
- Range:RSI values range from 0 to 100.
- Oversold:An RSI below 30 often indicates an oversold market, suggesting it may be time for a price bounce or reversal.
- Overbought: An RSI above 70 often indicates an overbought market, hinting at a potential price pullback or correction.
- Trends:RSI can also help identify prevailing trends. During an uptrend, RSI tends to stay above 30; in a downtrend it often stays below 70.
How to use the RSI Alerts Channel:
Our RSI alerts, posted every 6 hours, give you a snapshot of the broader market’s momentum. Use these insights to:
- Confirm trends: Are market-wide price moves supported by the RSI?
- Identify potential reversals: Look for overbought/oversold signals that might suggest a shift in sentiment.
Important: Always combine RSI readings with your other analysis tools for the most informed trading decisions!
Top Binance Traders Activity
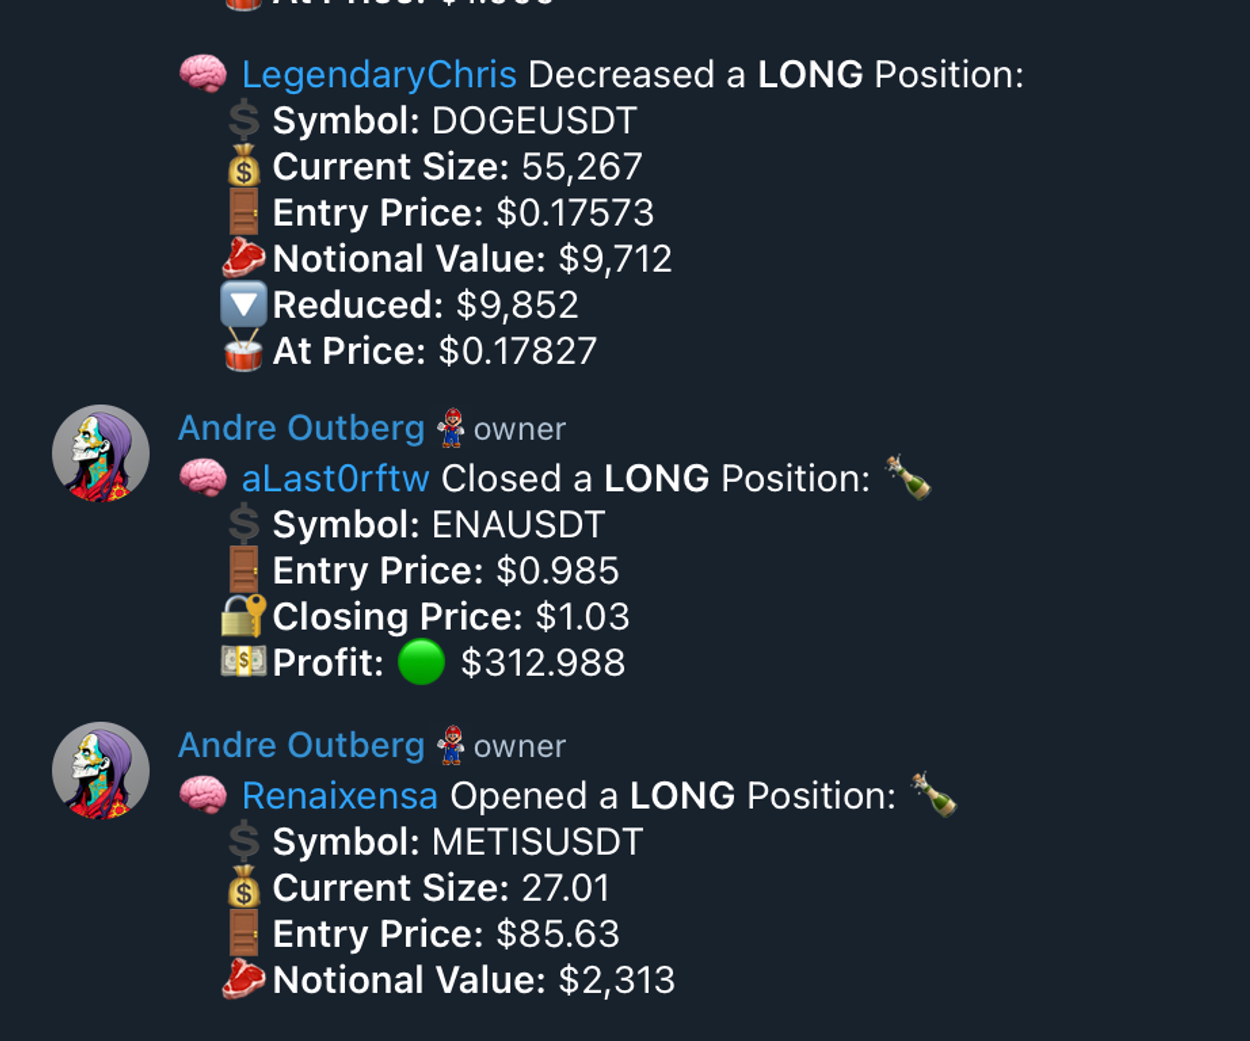
This live feed delivers real-time insights into the actions of Binance’s most consistently profitable traders.
Why is this valuable?
- Learn from the best: Observe the strategies and techniques used by successful traders.
- Idea generation: Get inspiration for your own potential trades.
- Market Validation: See if top traders are aligned with your own analysis.
Handpicked for Success: update the trader list weekly, ensuring it includes only those with proven profitability across multiple timeframes (7 days, 30 days, one month, all time).
What you’ll see:
- Trade Openings & Closings:Know when top traders enter or exit positions.
- DCA (Dollar-Cost Averaging): Track when they scale into trades gradually.
- Trade Adjustments:See how they manage positions by adjusting stop-losses or take-profits.
Important Note:Always use this information as a starting point for your own analysis and decision-making.
VIP Content From Other Paid Groups
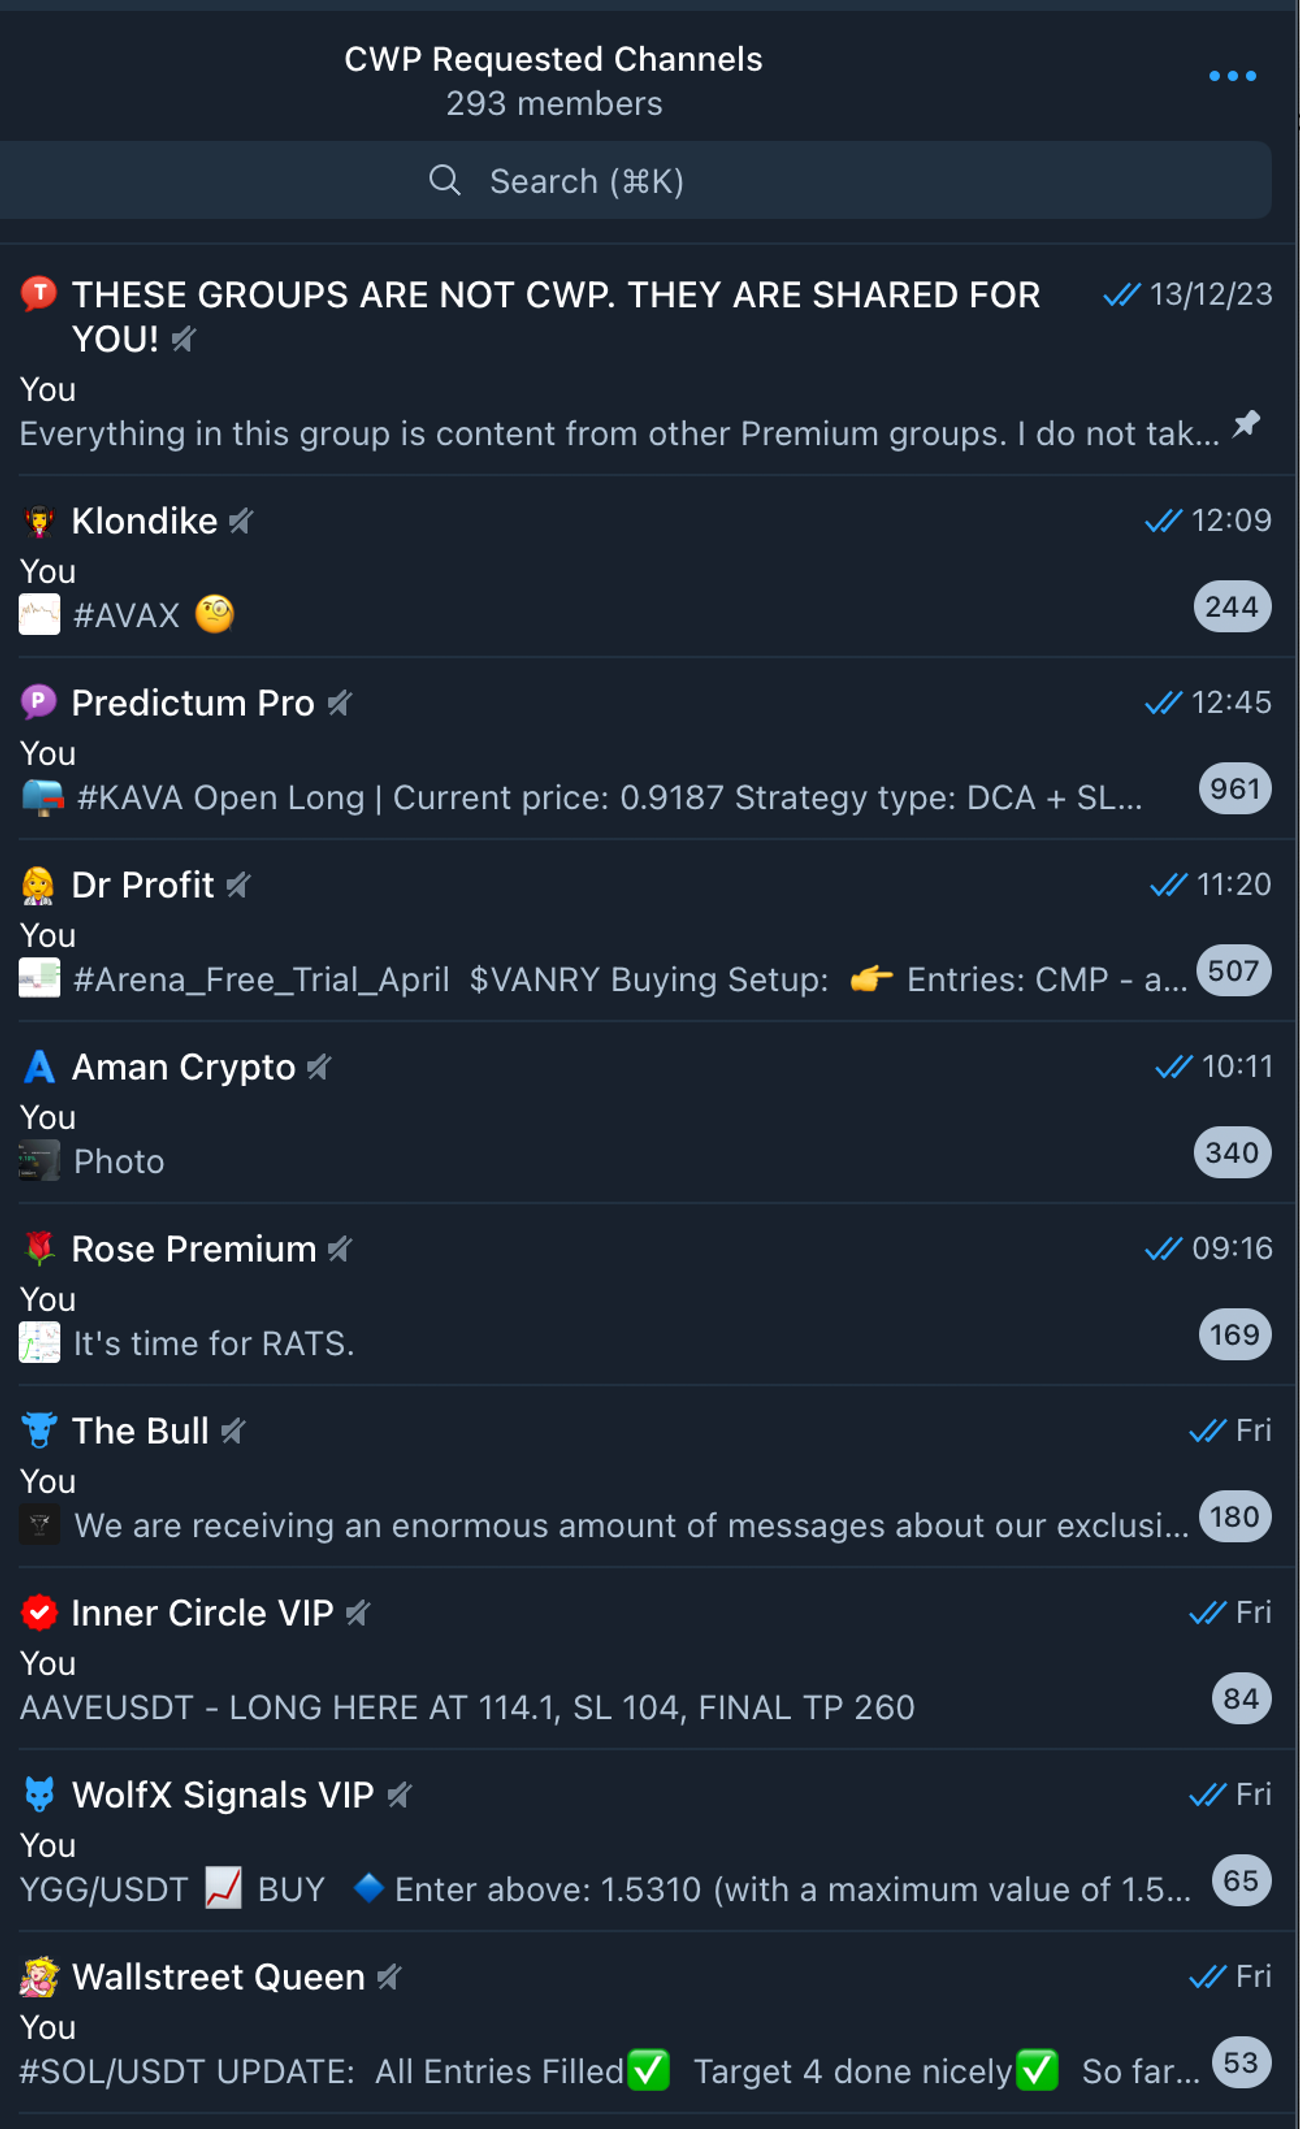
Your $100 monthly subscription unlocks a massive advantage: direct access to premium signals from top-rated groups, collectively worth over $2500 per month!
Featured Signal Providers:
- Dr Profit VIP
- Predictum Pro
- Inner Circle VIP
- Klondike VIP
- WolfX Signals VIP
- Wallstreet Queen VIP
- Aman Crypto VIP
- Alex Friedman VIP Signals
- Binance Killers VIP Signals
- Fed Russian Insiders VIP Signals
- Bitcoin Bullets VIP Signals
Effortless Automation (Select Providers):
I’ve integrated Cornix auto-trading for these groups, saving you time and maximizing your returns:
- Alex Friedman VIP Signals (Signals Risky channel)
- Binance Killers VIP Signals (Aggregated Signals channel)
- Fed Russian Insiders VIP Signals (Aggregated Signals channel)
- Bitcoin Bullets VIP Signals (Aggregated Signals channel)
Top Binance Traders Activity
This live feed delivers real-time insights into the actions of Binance’s most consistently profitable traders.
Why is this valuable?
- Learn from the best: Observe the strategies and techniques used by successful traders.
- Idea generation: Get inspiration for your own potential trades.
- Market Validation: See if top traders are aligned with your own analysis.
Handpicked for Success: I update the trader list weekly, ensuring it includes only those with proven profitability across multiple timeframes (7 days, 30 days, one month, all time).
What you’ll see:
- Trade Openings & Closings:Know when top traders enter or exit positions.
- DCA (Dollar-Cost Averaging): Track when they scale into trades gradually.
- Trade Adjustments: See how they manage positions by adjusting stop-losses or take-profits.
Important Note: Always use this information as a starting point for your own analysis and decision-making.
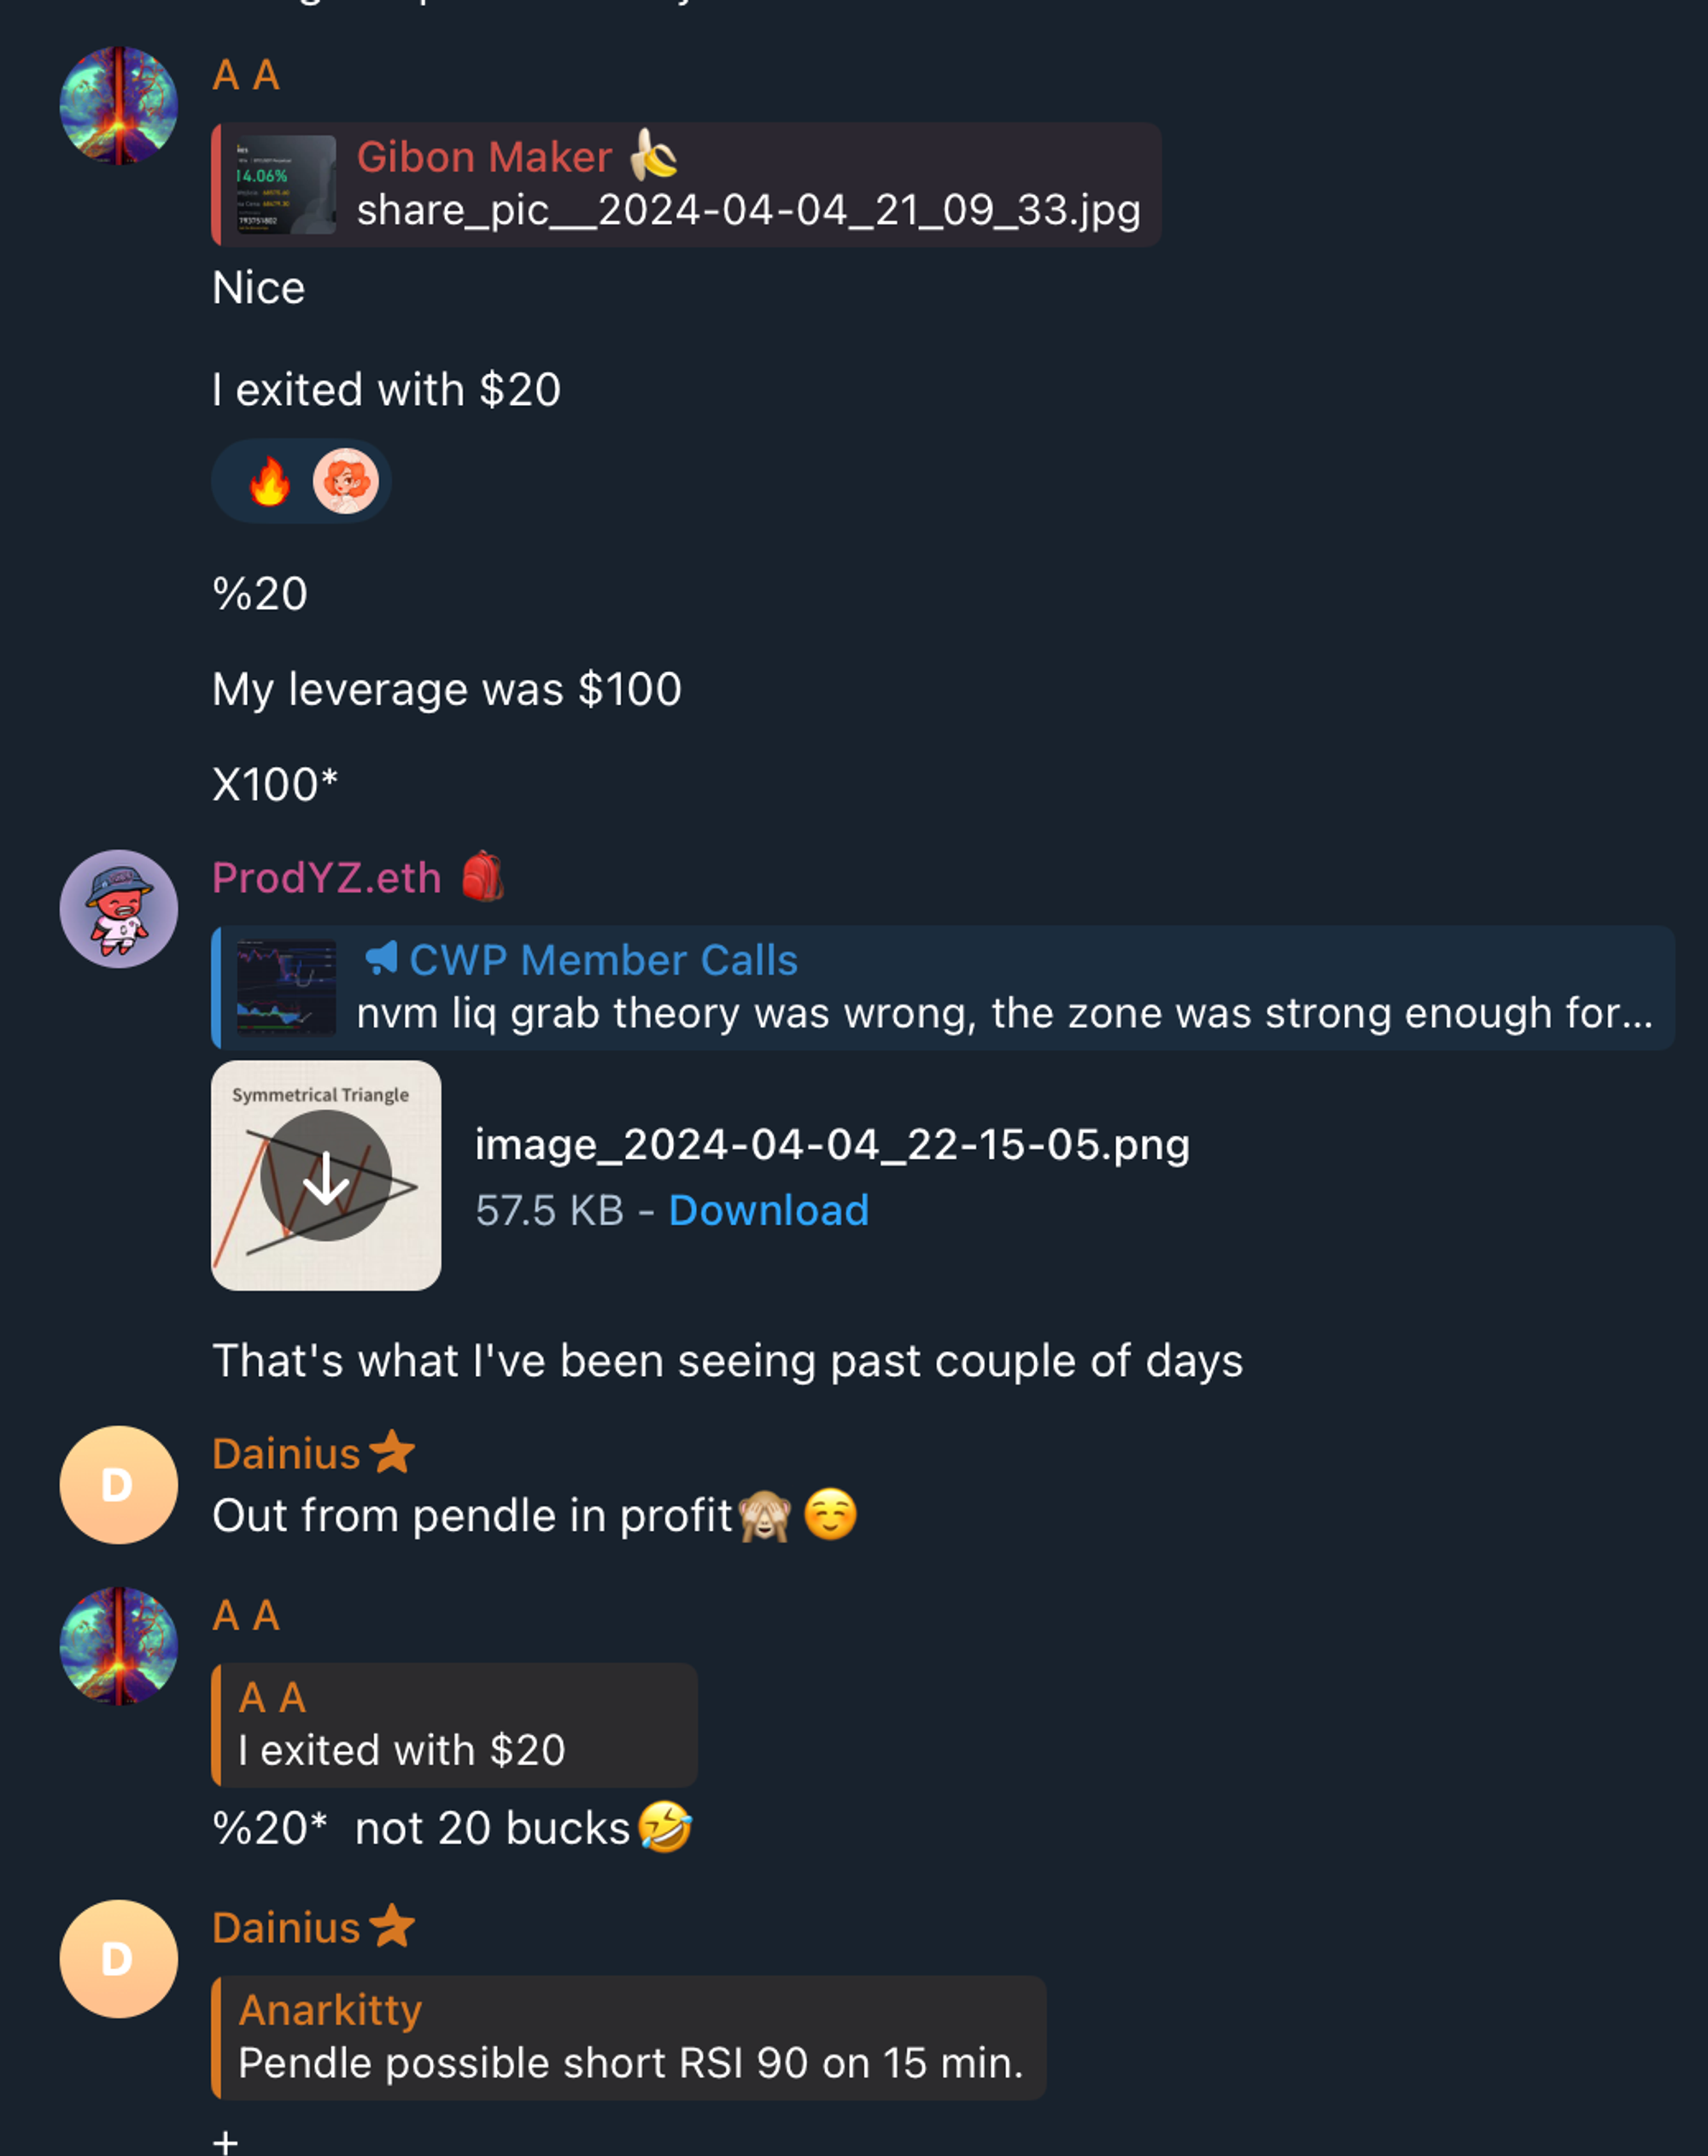
Members Calls
Members Calls
